
|
GUI - Image Displays > Dr. Probe / Documentation / GUI / Displays |
|
Image displays render image intensity distributions, diffraction patterns or other data maps as bitmaps.
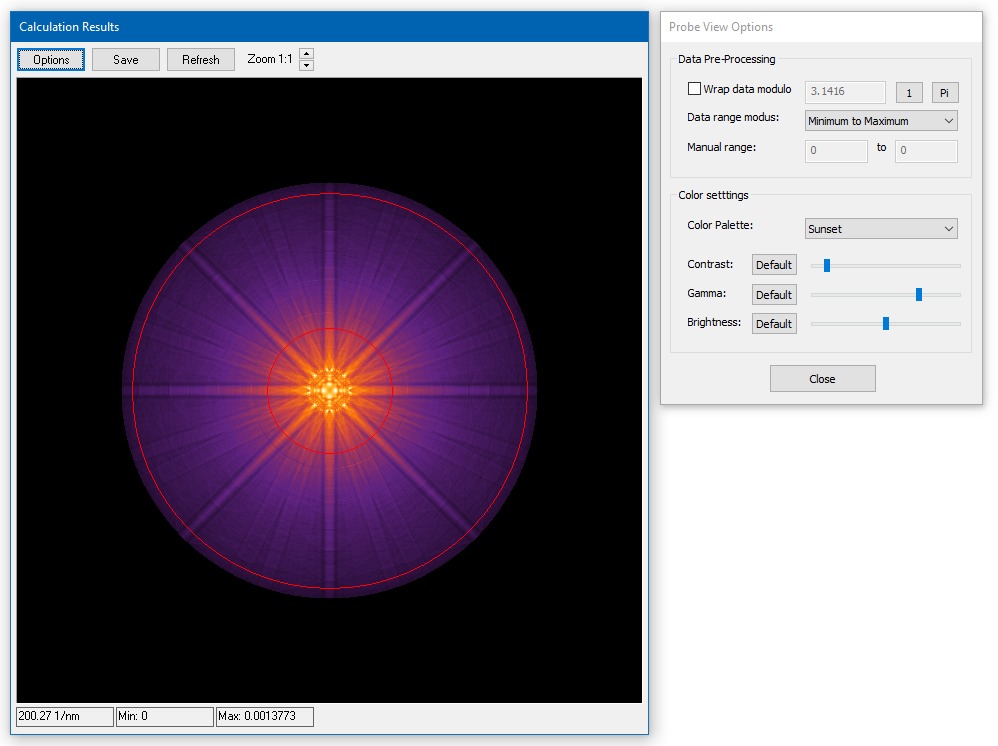
General data information is presented in the status bar at the bottom. The three numbers represent (from left to right) the horizontal size of the data in nanometers, the minimum data value and the maximum data value. Values from individual data points can be seen by a tool tip when moving the mouse pointer over the image area.
Choose the way how intensities are mapped to colors from the Options dialog. The data pre-processing includes options to clip the data range translated to a color scheme or display them modulo a certain value. The color settings provide a set of color schemes (palettes) to choose from. Sliders allow you adjust contrast, gamma, and brightness of the color mapping.
Last update: Feb 1, 2019 contact disclaimer(de)